Features
Digitizing data, reducing risk
Georgina marks an Ontario first with its innovative community risk dashboard
April 26, 2023
By
Laura Aiken
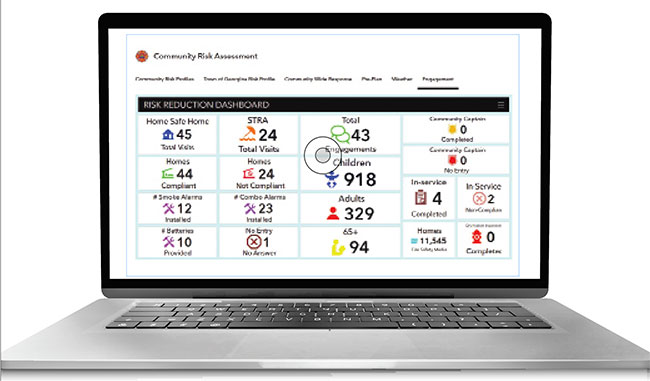 This image shows the new dashboard with the fire department’s 2023 stats after implementing the new software application to all the front run trucks.
Photo credit: Town of Georgina
This image shows the new dashboard with the fire department’s 2023 stats after implementing the new software application to all the front run trucks.
Photo credit: Town of Georgina Georgina Fire and Rescue Service introduced an Ontario first through the creation of a live data risk reduction portal for their community. The ability to track risks in real time, and target messaging for its community and fire partners, is part of the fire department’s completed community risk assessment and risk reduction plan. This plan has traditionally been done on paper and required an annual review. With live data, the community assessment is viewed daily, eliminating the need for annual reviews. Georgina’s portal was unveiled to the community on March 1. Data is dynamic, and this live portal gives real-time, meaningful information about the region it serves.
Deputy Chief Lorianne Zwicker spearheaded and worked alongside their GIS analytics team, in-house staff and corporate communications personnel on the technology. The apps were created entirely in house and built on ESRI and ArcGIS platforms. Multiple apps work to pull the data into one coherent picture. Zwicker learned coding by spending hundreds of hours on YouTube University. The leading-edge technology, which the Ontario Fire Marshal’s Office confirmed exceeds the requirements of provincial legislation, had a hard cost of only $58.41.
The Ontario Regulation O.Reg 378/18 regarding community risk assessments was announced by the Ontario Fire Marshal (OFM) in 2019 and is to be completed by all municipalities in Ontario by 2024.
How the portal works
The department spent eight months analyzing data to create the base portal, which divided the Town of Georgina into eight neighbourhood polygons so the community can be assessed at a town and granular level. The fire service decided to use neighbourhood polygons instead of response zones with the aim of improving community engagement and buy-in. Each of the department’s eight captains were then assigned a neighbourhood as the community risk lead, who is then provided with an engagement project specific to their polygon’s profile and a toolkit with the detailed messaging to deliver it with.
The new dashboard is installed and running on television screens in the captains’, fire prevention and chiefs’ offices at stations 1-4 and 1-6, which are Georgina’s full-time stations. The data updates every five minutes. The application is installed on the tablets in all front run trucks.
The risk reduction plan was built on the nine pillars advised by the OFM — geographic profile, building stock, critical infrastructure, demographics, hazard profile, public safety response, community services, economic profile and past loss and event history. This portal provides the data of these pillars at the user’s hover of a mouse. The risk assessment examines population, households, education, employment, workforce, languages, and household income. Key indicators provide details such as age demographics, immigration generations, housing built by year and spending profiles. Employment and commuting data further help support targeted messaging.
The portal allows the department to compare fire and loss statistics with the rest of Ontario, see an interactive overview of incident responses, view call data, and determine trends through heat mapping that highlight the categories of medical, hazards, open air burns, rescues, fires, multi-vehicle collisions and pre-fire conditions. Community descriptions further focus on schools, retail, highway, and water access along with future expansion plans, type of dwellings and make-up of households. Information on each neighbourhood polygon is cleanly and succinctly presented through infographics, graphs and bulleted statistics.
The dashboard has already provided the fire department with many key insights. While the top causes of fire for the Town of Georgina from 2019 to 2022 were electrical, cooking and smoking, a community focus showed differences in leading causes, and many did not mirror one another. The key indicators are used to allow for messaging tailored to the specific neighbourhood’s needs. For example, the fire department can see how many seniors are in the neighbourhood, what percentage of the overall town population that is, how many over the age of 65 live alone, and how many households live under a $20,000 a year income. The fire department can also see the top three languages spoken and the top three fire risks.
In addition to basic data gathered, the portal uses the 67 Lifestyle types of PRIZM Segmentation System to detail the diversity of the population in terms of how people think, shop, use the internet/social and where they eat to better tailor the mediums used to deliver messaging that is tailor-timed method-tuned to best reach its audience. The fire department has completed its high risk and critical infrastructure assessments, with that information now being live as well.
The live portal gives key indicators insights to assist with community engagement programs.
Risk reduction plan
The fire department built their public education and community engagement plan for 2023 based on risk assessment data from 2019 through 2022. This is their risk reduction plan, which outlines programs for platforms like social media and the website, school programs, home safe program and online self-inspection tool, year-round messaging through community partners and other tools such as Emergency Preparedness Week and Fire Prevention Week.
The risk reduction dashboard is populated via numerous data engines, but the user only needs to enter the data into one platform. Fire crews use a QR code that needs to be scanned once on their tablet on the truck to log their public safety activities in the portal so the effectiveness of their efforts can be quantified.
In considering the ample projected population growth, the fire department is also using the portal to create a building hazard analysis of all building stock. The risk matrix for all buildings is now complete and live. With summer coming, the priority area to focus on was the community’s marina’s and its 1447 slips.
“We have had devastating fires at these facilities and an inspection program and fire education program has been created to meet the risks,” shared Zwicker.
Community access and more
The community risk portal is now available to all the residents of Georgina. The interactive map allows the residents to learn about the top three risks specific to their community and also Georgina-wide. The community risk portal also expands on what other services are available through community partners, such as services for homelessness and other critical supports. An Emergency Management Portal, also now live, includes a weather tracker, links for planning for emergencies and a snowplow tracker. A link to the York Regional Police Community Safety Dashboard focuses on safety information, with particular attention to road safety, and tips for seniors and youths.
Zwicker and her collaborators have shown that ingenuity doesn’t have to cost a lot. The willingness to work hard and innovate can lead to a truly unique tool for supporting not only the fire department’s efforts to keep the community safe, but for empowering residents to see their risks for themselves and take action.
Print this page
Advertisement
- IdentiFire launches photoluminescent facepiece nameplate
- New Victoria Fire Department headquarters officially opens